To read your streaming analytics, you ignore the big number at the top and work down the dashboard in a fixed order: confirm what each platform counts, compare release windows instead of single days, check saves and repeat listening, read the source of streams, then turn one finding into one testable action. Most confusion in artist dashboards comes from treating a total as a signal when it is really just a count.
Here, streaming analytics means music streaming data from services like Spotify for Artists, Apple Music for Artists, YouTube Studio, SoundCloud stats and Amazon DSP for Artists. Not video pipelines, not event streams. If you have never looked past the headline stream total, this guide takes about 20 minutes to work through and then about five minutes per release week once you have the habit.
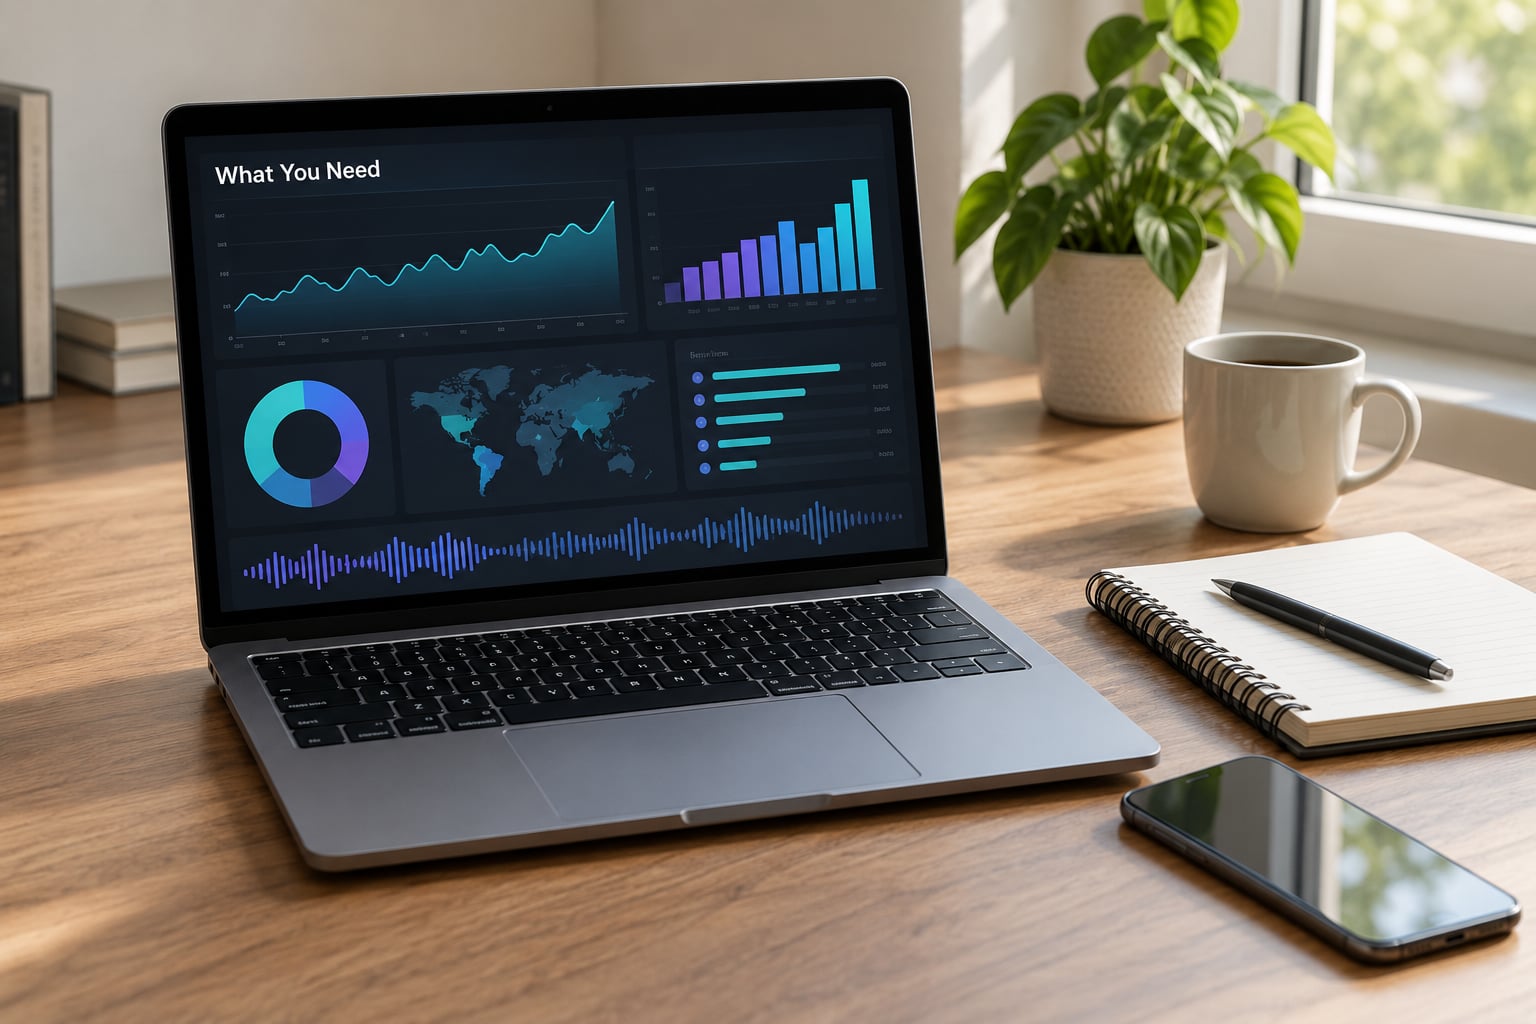
What You Need
You need access to the free dashboards, a way to export the numbers, and one thing no dashboard gives you: your own record of what you did and when. The first two are free. The third takes ten minutes to set up and saves you from misreading a trend later.
Here is what each free tool gives you, and what it does not:
- Spotify for Artists exposes monthly listeners, streams, followers, saves, playlist placements, top cities and countries, age and gender splits, listeners-also-like, and a source-of-streams breakdown. It does not tell you which campaign produced a click.
- Apple Music for Artists shows plays, listeners, saves and shares in its own vocabulary, and it can surface Shazam recognition data that Spotify cannot show you at all.
- YouTube Studio reports music-video and Shorts performance with its own view thresholds, plus search and suggested-traffic breakdowns that no audio platform provides.
- SoundCloud tracks plays, likes, reposts and comments, which makes it the only one of the five with a visible fan-comment signal.
- Amazon DSP for Artists reports streams, and its numbers often move later than the others because the reporting pipeline is different.
Claim your artist profiles before you release, not after. Spotify for Artists access can take days to sort out through your distributor, and a claim dispute during release week is a bad time to lose a week of data. If you work with a manager, label or publicist, add them as team members inside the dashboard rather than having them screenshot numbers into a group chat.
Next, find the export or download function in each dashboard and set up a recurring export. You want a time series, not a screenshot, because a screenshot has no date attached to it by the time you need it. Then build the part no dashboard gives you: a simple log with one row per action. Date, type (post, ad, playlist pitch, live show, email), cost if any, and what you changed. Without it you cannot connect a spike to a cause, and the first person on the internet to ask why a number moved will be you.
Step-by-Step: How to Read Your Streaming Analytics
1. Start With the Dashboard’s Defined Metrics
Every platform defines its own counting rules, so you check definitions before you compare numbers. Spotify registers a stream after roughly 30 seconds of listening. YouTube counts a view almost immediately. Apple counts plays on its own shorter window. The same word, three different thresholds.
Monthly listeners is the term that causes the most panic. It is not a follower count and it is not cumulative: it is a rolling 28-day window of unique listeners, which means a track can look like it “lost” listeners after a good promotional push simply because older listeners aged out of the window. The active audience figure, which Spotify surfaces separately, counts only people who listened in the last 30 days. Read the tooltip next to every number before you read the number.
2. Compare Release Trends Instead of One-Day Totals
One-day totals are noise. Release day spikes because your own posts, your friends and your mailing list all fire at once, and the day after looks like a collapse. Switch to weekly views, and compare release weeks to release weeks rather than to a random quiet month.
Set a baseline before you release. Record your weekly streams and monthly listeners for the four weeks before the drop. Then after the release, ask one question: is the new weekly level above the old baseline, or did it go back down to it? A campaign that returns straight to baseline bought you a moment, not an audience. Seasons matter too, and a festival month or a holiday will distort any month-over-month comparison you make without thinking about it.
3. Look at Saves, Repeats, and Engagement Signals
Saves and repeat listening tell you whether people came back. The listener-to-stream ratio does this in one number: roughly one stream per listener means people sampled you and left, while a ratio of ten or more means genuine repeat listening. That ratio is the closest thing to a skip rate most dashboards give you, since most of them do not show skips directly.
Artists on music marketing forums treat a save as worth more than a handful of streams, because a save signals intent to return. Album-level save rate below about three percent is a warning sign, and so is a stream count rising while saves, followers and your repeat ratio stay flat. That combination is the classic vanity metric trap, and it usually means paid traffic or algorithmic placement rather than a growing fanbase.
4. Identify Where Listeners Are Coming From
The source-of-streams breakdown is the screen labels and A&R read first. Interpret each line differently:
- Listeners’ own libraries and saved tracks are the healthiest source. If roughly 30 percent or more of your streams come from people who already had you, your audience is converting. A label view treats this as the number that matters.
- Algorithmic playlists like Discover Weekly and Release Radar are valuable and fragile. A track can land there, hold for weeks, then vanish after one playlist removes it.
- Editorial playlists are the biggest single jump when they land and the least predictable. You do not control when the add happens, so budget for the fact that a removal can cost you a week of numbers.
- Direct and profile traffic usually mean your own posts and your own push. Great for a launch spike, weak as a steady state.
Read your top cities the same way. City-level data is better than country-level data for routing, because a national number can look strong while all of it sits in two cities you have never played. Demographics tell you about fit rather than volume: if your age split does not match how you write or perform, your artwork, your bio and your playlist targets are probably mismatched, and that mismatch shows up later as a high skip pattern.
5. Compare Platforms Without Adding the Numbers Together
Do not sum your platforms into one big total. The play thresholds differ, the reporting windows differ, the audience behaviour differs, and each service devalues its own numbers differently, so an added total is a made-up number with a decimal point.
Compare direction instead. Look at whether each platform’s trend line is rising, flat or falling over the same four-week window, and treat that as your cross-platform read. Also use the platforms for what only they know. Apple can tell you how many people found you through Shazam. YouTube tells you search versus suggested traffic, and Shorts behaviour differs so much from long-form that mixing them distorts the picture. SoundCloud reposts and comments are a conversation signal, not a reach signal.
One limit is worth stating plainly: none of these dashboards attribute a stream to a specific campaign. If you ran ads, you will see a lift and you will not know which dollar produced it. The log you built in the first section is the only way to narrow that down.
6. Turn One Insight Into a Testable Next Action
An insight that changes nothing is just trivia. Take one finding from this release, write it as a single sentence, and turn it into one change you can measure on the next release.
- If your strongest cities are two markets far from each other, route the next run of shows toward them and see whether ticket sales follow the listener geography.
- If streams rose and saves did not, change the first fifteen seconds of the next single and watch the listener-to-stream ratio instead of the stream total.
- If most traffic is algorithmic and none is from listeners’ own library, spend the next cycle on save-worthy assets and a release that gives people a reason to keep you.
- If listeners-also-like names artists in a scene you have never tried, treat that list as your collaboration shortlist for the next project.
One insight, one change, one number you watch. That is the whole method.
Common Mistakes
Chasing total plays. Raw streams are the easiest number to buy and the least useful to optimise. Streams per listener, save rate and source mix tell you whether the plays came from people who came back.
Treating platforms as identical. Spotify, Apple, YouTube and SoundCloud do not count a play the same way, and they do not report on the same delay. Compare direction, not totals.
Ignoring release context. A week with a feature, a festival slot or a big post will look like growth whether or not the audience grew. Note the context in your log every time.
Reacting to outliers. One strange country, one odd day, one huge spike from a single playlist is usually a one-off. Artists on Reddit’s r/SpotifyArtists and r/musicmarketing ask this question constantly, and the consistent answer is to wait a full week and see whether the level holds.
Treating followers as guaranteed sales. Followers are a notification permission, not a purchase. They matter for tour announcements, not for merch or ticket forecasts.
Buying promotion and calling it growth. Forum consensus treats purchased streams as net-negative: bot listeners skip early, which pushes skip rates up and save ratios down, damaging algorithmic reach rather than helping it.
Frequently Asked Questions
What is streaming analytics for musicians?
Streaming analytics for musicians is the collection and interpretation of listener data from services such as Spotify, Apple Music, YouTube Music, SoundCloud and Amazon Music. It covers how many unique people listened, how many times they played a track, and how many saved, followed or added it to a playlist. Each platform sets its own counting rule, so the numbers are only comparable within a single dashboard.
Can you see your streaming numbers on Spotify?
Yes. Claim Spotify for Artists before you release and you get monthly listeners, streams, followers, saves, playlist placements, top cities, age and gender splits and a source-of-streams breakdown for free. Claim access comes through your distributor and can take days, so do it well ahead of release week. What you cannot see is which individual campaign or advertisement produced a stream.
How do I view YouTube analytics for music?
Open YouTube Studio and go to the Analytics tab, then the Reach tab for views, watch time and traffic sources. Use the Advanced tab to filter by the last 28 days and by content type, which lets you separate long-form music videos from Shorts. The reach report shows where views came from, including search and suggested traffic, and retention shows where viewers drop off inside the video.
Why does the same track show different numbers on Spotify and YouTube?
Because a play is defined differently. Spotify counts a stream after roughly 30 seconds, while YouTube counts a view much sooner, so a listener who clicks away immediately still registers on YouTube but not on Spotify. Reporting delays and deduplication rules also differ. Compare the direction of each platform’s trend over the same window instead of adding the totals together.
Are Spotify streaming numbers accurate?
The numbers are accurate measurements of what the platform counted, but they are not measurements of fans. Paid playlist placements and bot traffic inflate stream counts without producing listeners who return. Tell-tale signs include a sudden spike from unfamiliar countries, a jump in streams with no matching rise in saves or followers, and a listener-to-stream ratio close to one to one. Watch the trend over a full week rather than the peak day.
What is active audience on Spotify?
Active audience counts the people who listened to your music in the last 28 days, which is the same rolling window used for monthly listeners but is easier to read per release. The difference is that it excludes the listeners who only appear in a single spike and shows how many people are still around. A release that grows active audience is building something; one that only spikes total streams is not.
Conclusion
Pick one release, record your baseline the four weeks before it, then review on the same fixed window afterwards. Read the source-of-streams breakdown and the listener-to-stream ratio before the headline number, and let the strongest signal choose your next decision: a city for a show, a change to the first fifteen seconds of a single, or a playlist category worth targeting. Repeat that on every drop, and your analytics stop being a scoreboard and start being a plan.